AKADEMIYA2063’s COVID-19 portal
Staple Food Price Tracking
LOCAL STAPLE FOOD MARKET DYNAMICS UNDER COVID
The pandemic is likely to be more disruptive to local food markets and thus have more serious effects on the poorest and most vulnerable groups and communities than any of the crises in recent years. This is because the poor and vulnerable are affected by changes in local food staple prices significantly more than other population groups, not only because of more limited purchasing power but also because of differences in consumption baskets. Moreover, domestic markets for local food staples such as yam, cassava, white maize, cowpeas, millet or sorghum tend to behave differently during times of crisis than global markets for major commodities such as rice, wheat or yellow maize. For instance, the last global food price crisis had much more significant impacts on the latter group of food commodities. Local food staples markets tend to be rather segmented from global food markets. Staple food prices therefore tend to be isolated from global market shocks. The difference with Covid-19 is that the disruption of food supply chains has hit both domestic and global food markets rather badly.
The global nature and complex ramifications of the pandemic make it impossible to avoid the pain from rising food prices, in particular among vulnerable groups. Different staples weigh differently in local diets. Different communities are affected differently by changes in prices of different staples. Some markets are more connected than others and therefore price changes for the same staple food vary across geography and over time. Consequently, a good understanding of how local staples markets behave and close tracking of changes in food prices at community level have to be key elements of any strategy to protect livelihoods.
AKADEMIYA2063 scientists and their partners are working to ensure that governments and other national stakeholders have sufficient information to plan and respond to the effects of the pandemic on local markets.
INTRODUCTION
Food prices are a key variable that must be monitored to inform efforts to anticipate and respond to food crises. During the evolving COVID-19 crisis, near real-time food price data is vital not just to provide a picture of current developments that affect people’s ability to maintain healthy diets but also to inform efforts to predict the short- and medium term effects of the crisis. Most global efforts track only major commodities, or focus on prices in international markets or in the largest cities in a country. This misses not only the bigger picture of food prices across a country, but also the locally important foods consumed in vulnerable areas. We will focus on price data at a more granular, community level and primarily for local staples that are more widely consumed by the poor and vulnerable. The team will perform descriptive analysis of the data, characterizing trends over time, assessing volatility, identifying spikes, examining geographic differences within and between countries, and investigating price transmission between markets.
Bulletins
Briefs
Data, charts and maps
_thumb.png)
Actual and predicted millet prices trend in Touba Toul, Senegal (CFA francs per kg)
_thumb.png)
Actual and predicted millet prices trend in Touba, Senegal (CFA francs per kg)
_thumb.png)
Actual and predicted millet prices trend in Porokhane, Senegal (CFA francs per kg)
_thumb.png)
Actual and predicted millet prices trend in Passy, Senegal (CFA francs per kg)
_thumb.png)
Actual and predicted millet prices trend in Ndrame Escale, Senegal (CFA francs per kg)
_thumb.png)
Actual and predicted millet prices trend in Ndoffane, Senegal (CFA francs per kg)
_thumb.png)
Actual and predicted millet prices trend in Mpal, Senegal (CFA francs per kg)
_thumb.png)
Actual and predicted millet prices trend in Méréto, Senegal (CFA francs per kg)
_thumb.png)
Actual and predicted millet prices trend in Mbirkilane, Senegal (CFA francs per kg)
_thumb.png)
Actual and predicted millet prices trend in Mbafaye, Senegal (CFA francs per kg)
_thumb.png)
Actual and predicted millet prices trend in Kouthiaba, Senegal (CFA francs per kg)
_thumb.png)
Actual and predicted millet prices trend in Diamagadio, Senegal (CFA francs per kg)
_thumb.png)
Actual and predicted millet prices trend in Diakhao, Senegal (CFA francs per kg)
_thumb.png)
Actual and predicted millet prices trend in Thiès, Senegal (CFA francs per kg)
_thumb.png)
Actual and predicted millet prices trend in Tambacounda, Senegal (CFA francs per kg)
,_Senegal_(CFA_francs_per_kg)_thumb.png)
Actual and predicted millet prices trend in Thiaroye (Dakar), Senegal (CFA francs per kg)
,_Senegal_(CFA_francs_per_kg)_thumb.png)
Actual and predicted millet prices trend in Saint-Maur (Ziguinchor), Senegal (CFA francs per kg)
_thumb.png)
Actual and predicted millet prices trend in Saint-Louis, Senegal (CFA francs per kg)
_thumb.png)
Actual and predicted millet prices trend in Sédhiou, Senegal (CFA francs per kg)
_thumb1.png)
Actual and predicted millet prices trend in Ourossogui, Senegal (CFA francs per kg)
_thumb.png)
Actual and predicted millet prices trend in Louga, Senegal (CFA francs per kg)
_thumb.png)
Actual and predicted millet prices trend in Kolda, Senegal (CFA francs per kg)
_thumb.png)
Actual and predicted millet prices trend in Kédougou, Senegal (CFA francs per kg)
_thumb.png)
Actual and predicted millet prices trend in Kaolack, Senegal (CFA francs per kg)
_thumb.png)
Actual and predicted millet prices trend in Kaffrine, Senegal (CFA francs per kg)
_thumb.png)
Actual and predicted millet prices trend in Fatick, Senegal (CFA francs per kg)
_thumb.png)
Actual and predicted millet prices trend in Diourbel, Senegal (CFA francs per kg)
_thumb.png)
Actual and predicted millet prices trend in Bakel, Senegal (CFA francs per kg)

Surging price spikes among rural markets in Senegal

Source: Based on Senegal’s Market Information System data (2010-2020).
Note: The price gap is calculated as follows: “(observed price - predicted price)/predicted price”.

Rapid increase in the share of retail markets with higher than predicted prices, Senegal

Source: Based on Senegal’s Market Information System data (2010-2020).
Note: The price gap is calculated as follows: “(observed price - predicted price)/predicted price”. The sign of the computed price gap is used to make this graph.

Difference between actual and predicted millet price across markets in deficit areas in Senegal

Source: Based on Senegal’s Market Information System data (2010-2020).
Note: The price gap is calculated as follows: “(observed price - predicted price)/predicted price". The different categories are defined as follows: (i) Large increase if the difference between the observed price and the predicted price is greater than 10%, (ii) Moderate increase if the difference is between 5 and 10%, (iii) Normal trend if the difference is between -5 and 5%, (iv) Moderate decrease if the difference is between -10% and -5%, (v) High decrease if the difference is less than -10%.

Difference between actual and predicted millet price across markets in surplus areas in Senegal

Source: Based on Senegal’s Market Information System data (2010-2020).
Note: The price gap is calculated as follows: “(observed price - predicted price)/predicted price". The different categories are defined as follows: (i) Large increase if the difference between the observed price and the predicted price is greater than 10%, (ii) Moderate increase if the difference is between 5 and 10%, (iii) Normal trend if the difference is between -5 and 5%, (iv) Moderate decrease if the difference is between -10% and -5%, (v) High decrease if the difference is less than -10%.
Past webinars
Other workstreams


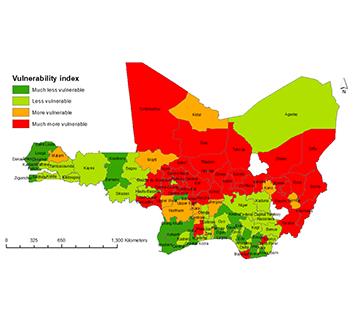
Mapping community vulnerability to identify potential major hot spots


.png)
.png)
.png)
.png)
.png)
.png)
.png)
.png)
.png)
.png)
.png)
.png)
.png)
.png)
.png)
,_Senegal_(CFA_francs_per_kg).png)
,_Senegal_(CFA_francs_per_kg).png)
.png)
.png)
.png)
.png)
.png)
.png)
.png)
.png)
.png)
.png)
.png)
