Portail COVID-19 d'AKADEMIYA2063
Perturbation des systèmes de production
PROBLÈME DES DONNÉES SUR LA PRODUCTION DES CULTURES VIVRIÈRES : PISTES DE SOLUTIONS
Les effets perturbateurs de la Covid-19 sur les systèmes de production alimentaire sont réels : difficulté d’accès aux semences et aux engrais, circulation limitée des marchandises, baisse de la demande, pénurie de main-d’œuvre, en sont quelques exemples. Dans ce contexte, le défi ne consiste pas seulement à saisir l’ampleur et la complexité probables des perturbations, mais également à les identifier et à en assurer un suivi en temps réel. Contrairement à la propagation de la maladie elle-même, qui elle peut être suivie par le biais de tests et du traçage, il demeure difficile, même en temps normal, d’obtenir des informations précises sur les activités agricoles. L’introduction du confinement et des diverses mesures de restriction pour contrôler (ou limiter les effets de) la pandémie rend cette tâche encore plus ardue. Il n’existe aucun moyen de savoir si les agriculteurs ont accès aux intrants (en temps voulu et en quantité suffisante), s’ils ont été trop malades pour s’occuper de leurs fermes ou s’ils n’ont pu travailler que partiellement. Les réponses à ces questions ne pourront être obtenues qu’en fin de la saison en fonction de l’impact sur les quantités récoltées. A ce moment-là, il est déjà trop tard et il ne reste plus qu’à affronter la situation de crise.
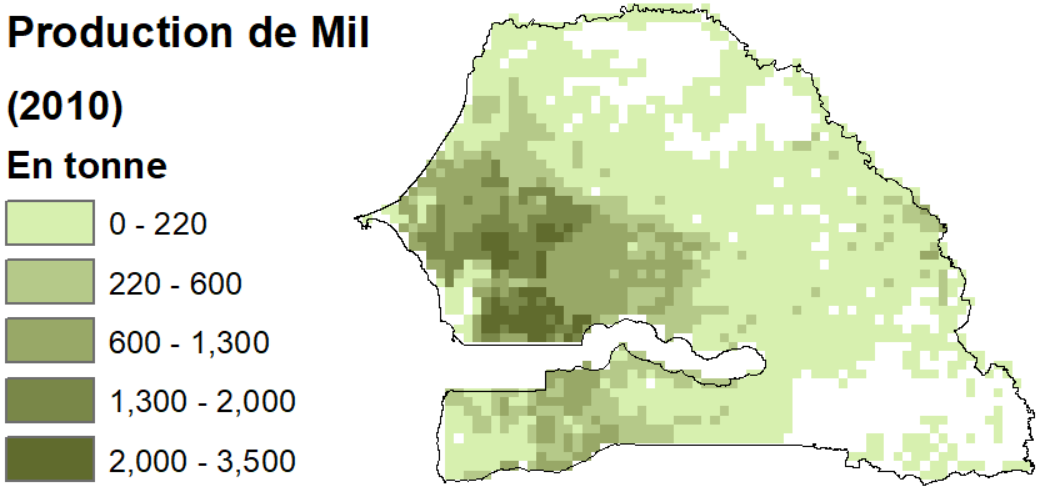
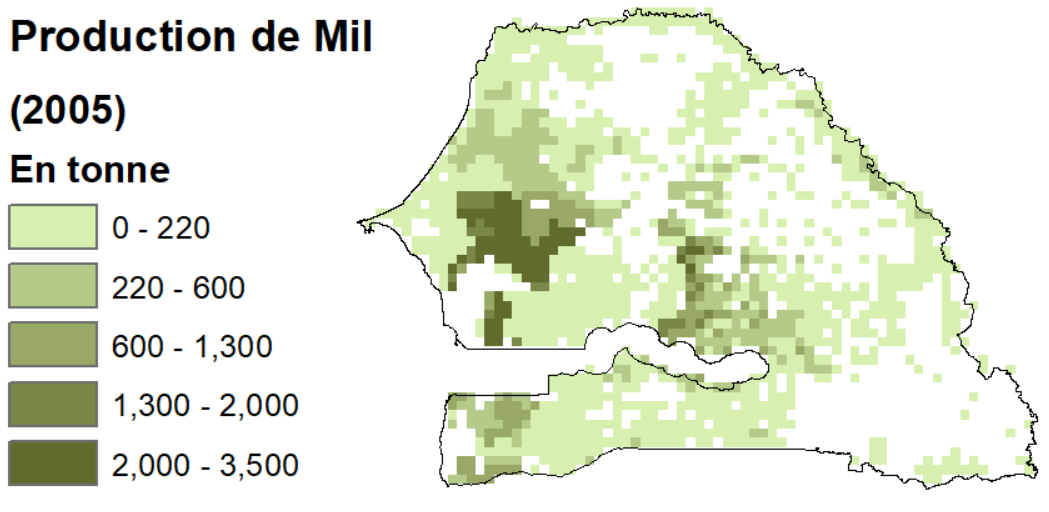
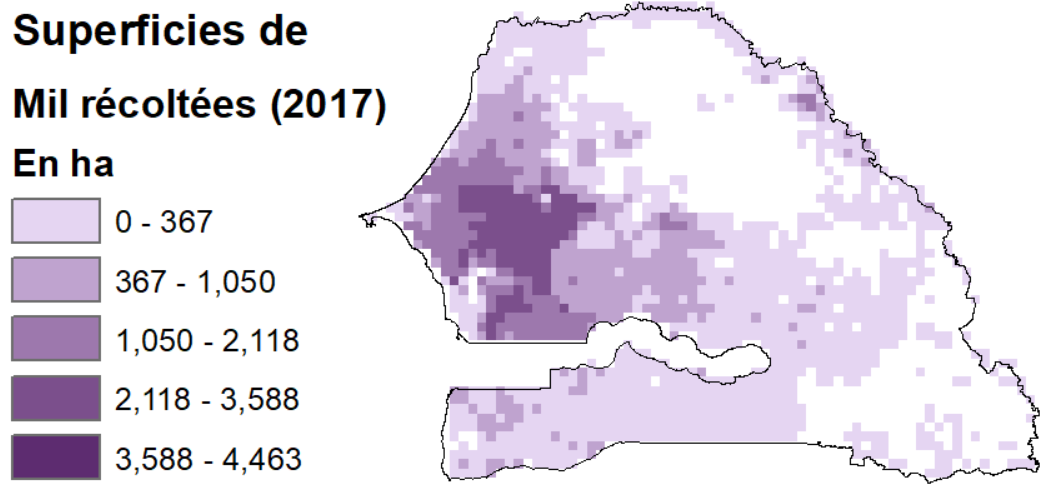
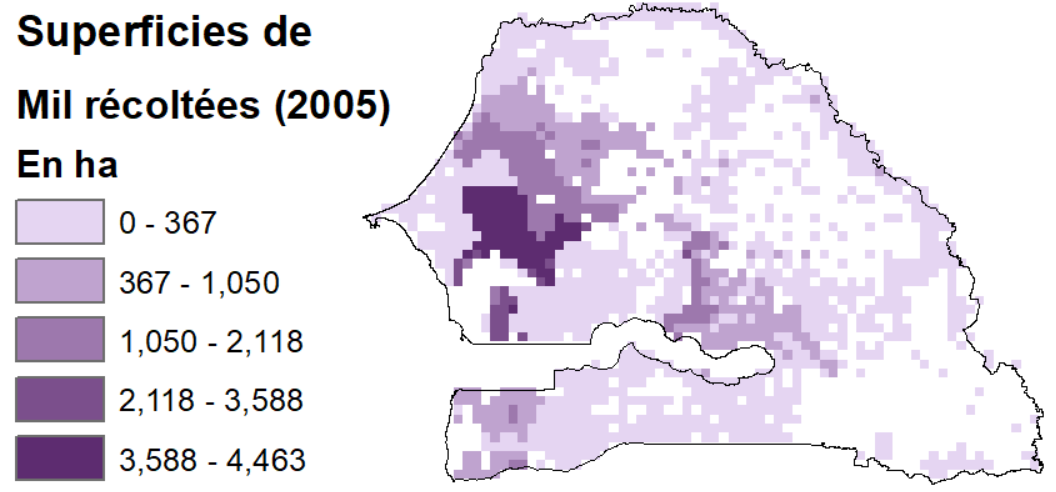
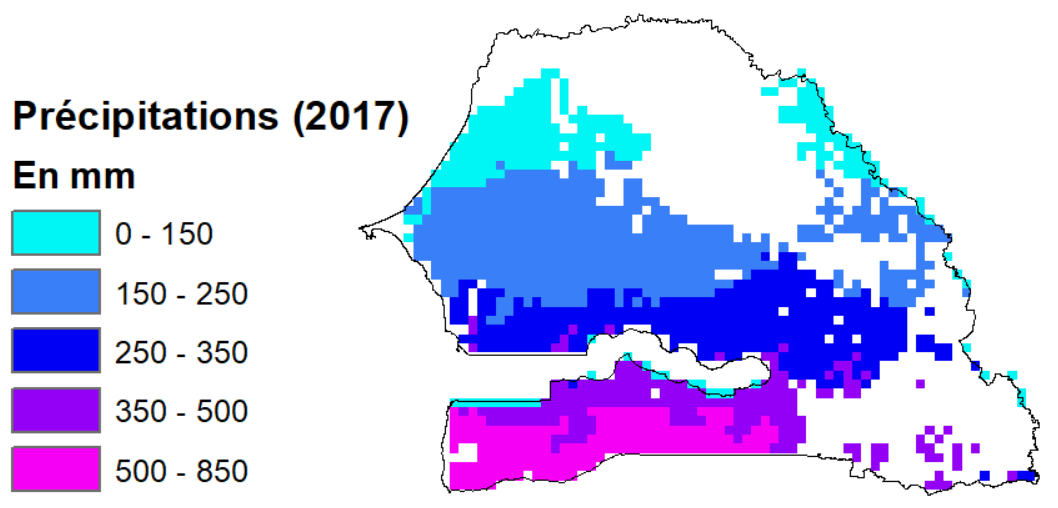
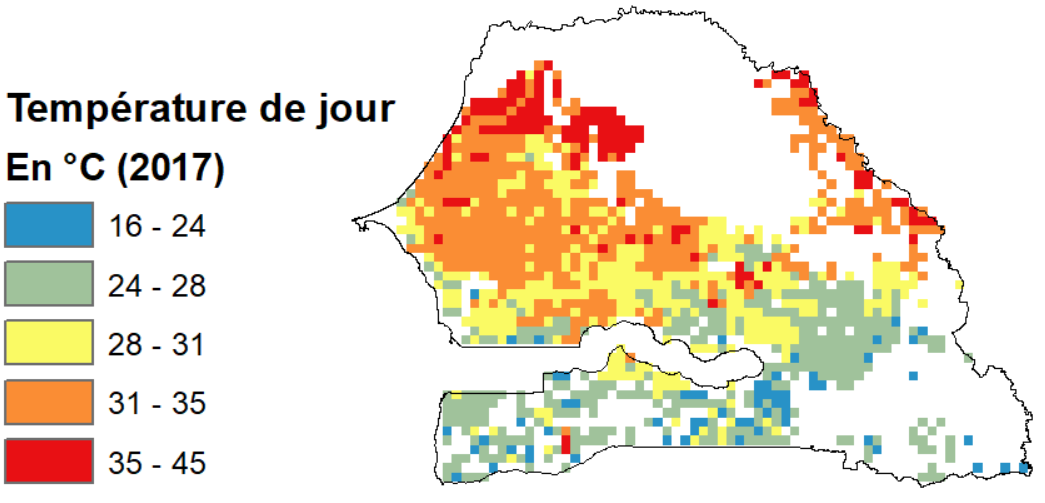
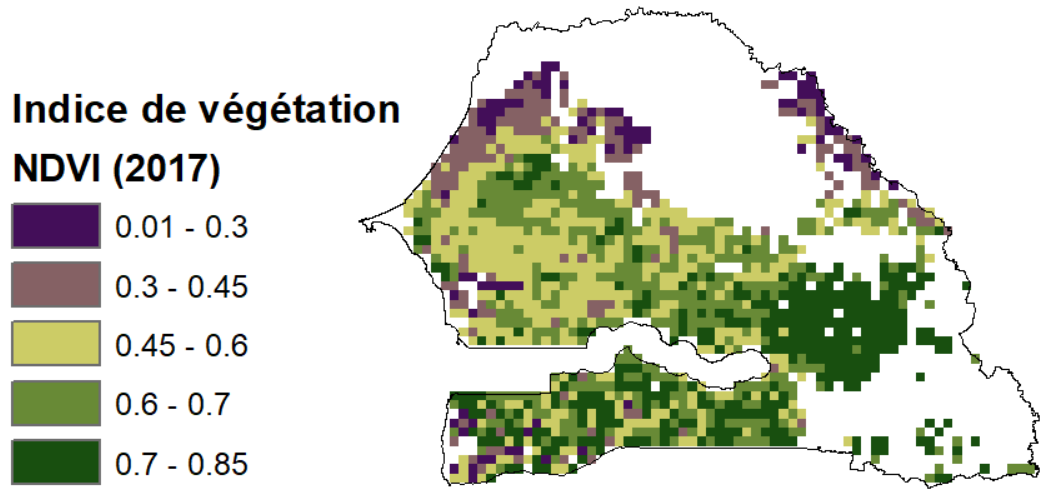
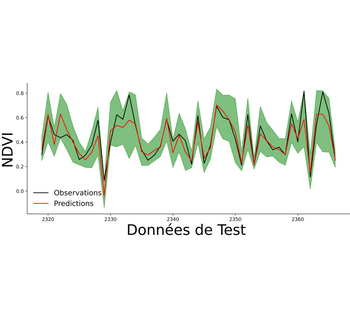
L’absence totale d’informations sur les conditions culturales en temps de crise peut être surmontée en utilisant les technologies numériques modernes. Les données de télédétection permettent de suivre en temps réel l’évolution de la couverture végétale, les données météorologiques et bien d’autres paramètres liés aux activités agricoles. Les récents développements en matière d’apprentissage automatique et de modélisation informatique permettent de suivre et de projeter la production agricole à l’aide de ces données. Les avantages vont bien au-delà de la capacité à surmonter les obstacles à la collecte de données pendant les périodes de crise. Les nombreuses limites qui empêchent l’accès à des statistiques agricoles de bonne qualité peuvent également être surmontées grâce à ces technologies numériques, à savoir l’estimation des terres arables, des surfaces emblavées, des rendements ou la distribution géographique des quantités récoltées. Nos chercheurs utilisent ces technologies pour évaluer les changements dans les systèmes de production alimentaire durant la pandémie et ainsi fournissent des informations clés permettant de mieux lutter contre les effets de la COVID-19 au niveau des communautés locales.
INTRODUCTION
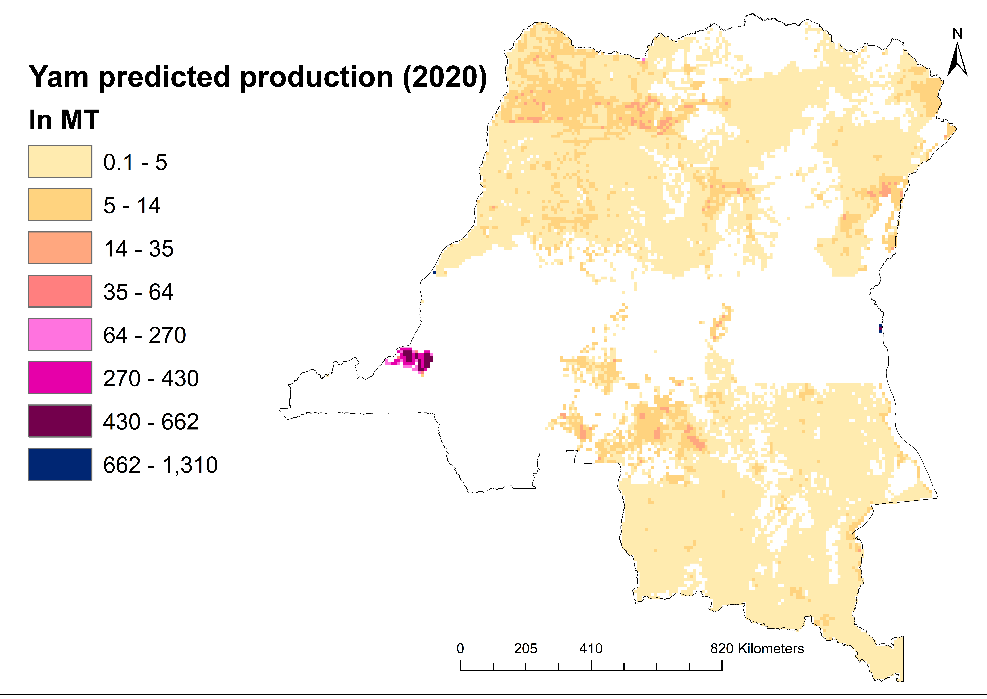
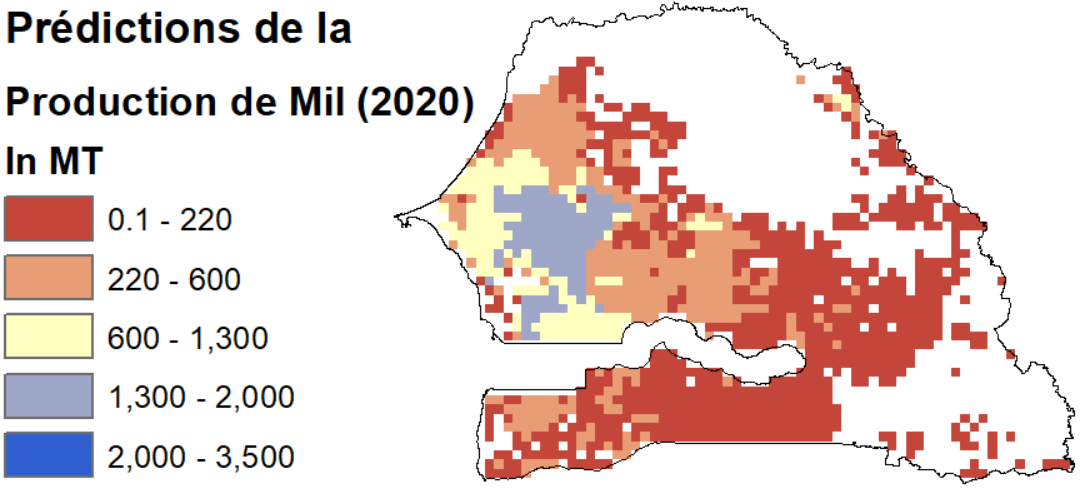
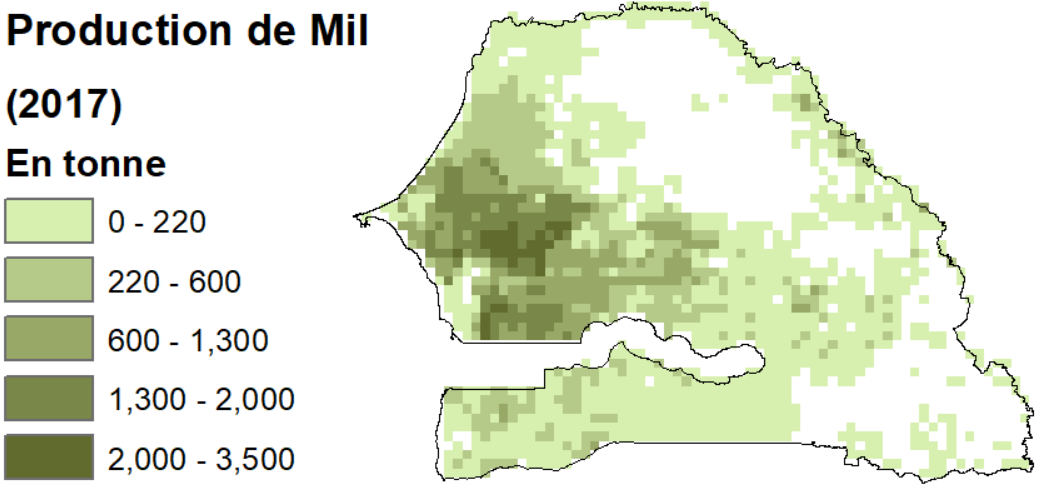
On estime que la pandémie de COVID-19 aura des impacts de grande envergure sur les systèmes de production. Ces effets résultent d’une série de perturbations dans de nombreux secteurs tels que la santé, mais aussi le transport, le marché et les systèmes alimentaires en général. En raison des contraintes à la collecte directe des données sur le terrain, il est actuellement difficile d’évaluer la situation et de fournir une image précise des ramifications de la crise. Dans le cadre de cet axe de travail, nous utiliserons des méthodes innovantes de télédétection, de collecte de données à grande echelle (big data) et d’apprentissage informatique, afin de mettre au point des outils qui nous permettront d’évaluer l’impact sur les systèmes de production au niveau des communautés locales. Nous suivrons la saison de croissance des principales denrées de base locales et nous utiliserons nos outils pour publier des prévisions en temps réel sur la production alimentaire future au niveau communautaire dans un certain nombre de pays. Des comparaisons entre les niveaux de production prévus pour 2020 et ceux des années précédentes ainsi que des techniques de modélisation des cultures seront utilisées pour estimer le rôle de la COVID-19 dans les perturbations de la production.
Autres axes de travail
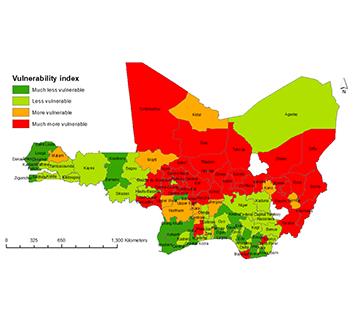
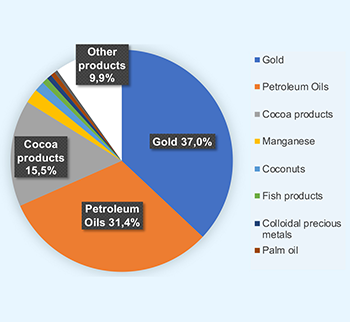
Suivi de l’évolution des prix des denrées alimentaires de base et de leur impact sur la sécurité alimentaire et nutritionnelle






_and_2017_(MAPSPAM)_ratio_of_Yam_production_in_The_Democratic_Republic_of_Congo_thumb1.png)
_and_2017_(MAPSPAM)_ratio_of_Yam_production_in_The_Democratic_Republic_of_Congo1.png)
